



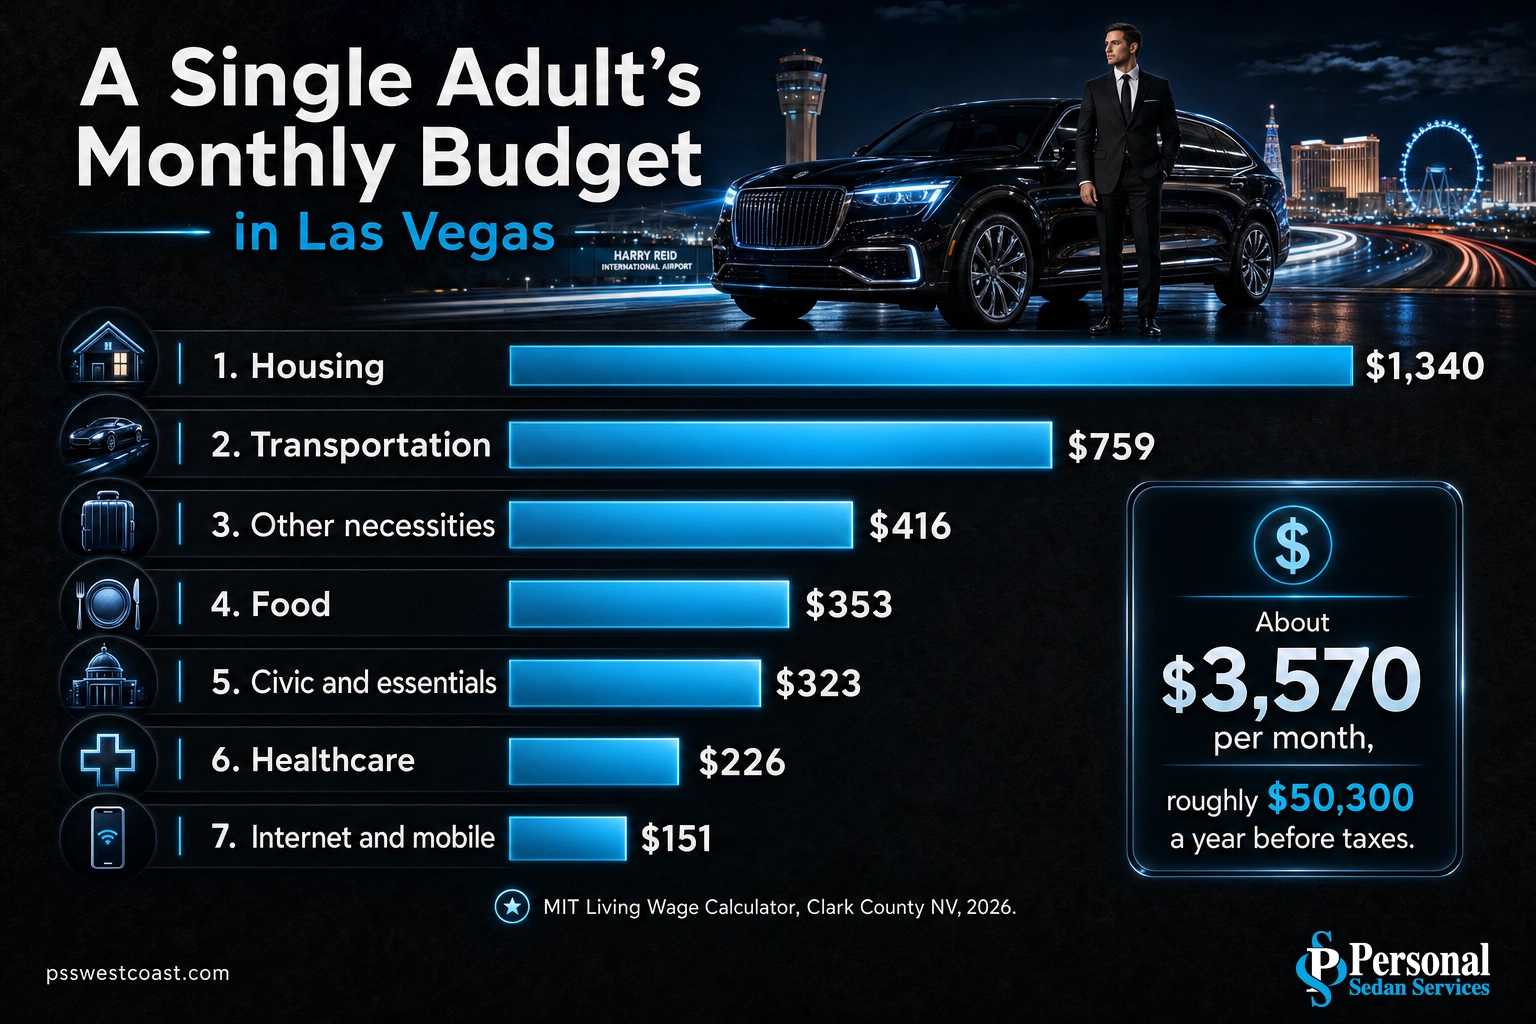
The honest answer to “what does it cost to live in Las Vegas?” is about $3,570 a month for a single adult on a modest budget, and roughly $9,000 a month after taxes for a family of four, based on the MIT Living Wage Calculator for Clark County. But those totals hide a lot. Nevada’s zero state income tax and cheap electricity pull the number down, while an 8.375% sales tax and home prices now above the national median push it back up. This guide breaks the cost of living in Las Vegas down category by category, with real 2026 figures and where each dollar actually goes.
- A single adult needs about $3,570 a month to cover basics (roughly $50,300 a year before taxes), per the MIT Living Wage Calculator for Clark County, updated February 2026.
- Housing is the swing factor. The average Las Vegas apartment rented for about $1,460 a month in 2026, while the median existing single-family home sold for around $475,000, per Las Vegas REALTORS.
- No state income tax is Nevada’s headline perk. The trade-off is an 8.375% Clark County sales tax and reliance on other fees.
- Electricity is cheap, but summer bites. NV Energy’s typical residential electric bill averages about $154 a month, and July and August run much higher on air conditioning.
- A family of four’s biggest hidden line is childcare, about $2,340 a month for two kids, which can rival the mortgage.
- Comfortable, not just surviving, means targeting $60,000 to $75,000 for a single adult; Las Vegas’s median household income was about $73,900 in the 2024 Census data.
What’s in This Guide
- What It Actually Costs to Live in Las Vegas
- How Las Vegas Compares to the National Average
- Housing: Rent and Buy Prices in 2026
- Cost of Living by Neighborhood
- Utilities: Why Summer Is the Budget Wildcard
- Groceries and Eating Out
- Transportation and Getting Around
- Healthcare Costs
- Childcare and Family Costs
- Taxes: Nevada’s Big Advantage and Its Limits
- Sample Monthly Budgets: Single, Couple, Family
- How Much Income You Need
- Las Vegas vs the Cities People Move From
- Cost of Living at a Glance
- How to Keep Your Budget in Check
- Moving to Las Vegas: What to Do Next
- Related Resources
- Frequently Asked Questions
- Sources and Methodology
What It Actually Costs to Live in Las Vegas
Most cost-of-living pages hand you a single index number and move on. That number hides the two things that actually decide your Las Vegas budget: how much you spend on housing, and how many people you are supporting. So instead of one figure, start with a grounded baseline from the MIT Living Wage Calculator, an academic model that builds a bare-bones budget for each household type in a specific county.
For Clark County, home to Las Vegas, Henderson, and North Las Vegas, the February 2026 model puts a single adult’s no-frills cost of living at about $42,800 a year after taxes, or roughly $3,570 a month. That covers rent, food, transportation, healthcare, an internet and phone line, and the odds and ends of daily life, but nothing extra, no savings, no vacation, no restaurant habit. Add the taxes you still pay in Nevada, and the pre-tax income a single adult needs lands near $50,300 a year.
Scale that up and the picture changes fast. A single parent with one child needs about $86,700 before taxes, and a family of four with both parents working needs roughly $121,900. The jump is not mostly rent, it is childcare, which we break out below. The point for anyone weighing a move: your Las Vegas cost of living is less a fixed city number and more a function of your housing choice and your household size.
Las Vegas is spread across a wide desert valley, so where you live inside it matters. A newer master-planned home in Summerlin or Henderson costs more than an older place in the central valley, and utility bills swing with the size of the home you are cooling all summer. Wherever you land, getting around town is its own line item, which is why a lot of new residents rethink whether they need a second car or would rather lean on a licensed local car service for everyday trips than run a second vehicle around the valley.
The region this guide covers: the Las Vegas metro area (Clark County), including the city of Las Vegas, Henderson, North Las Vegas, Summerlin, Enterprise, and Paradise. Cost figures are metro-wide unless a neighborhood is named.
Source: MIT Living Wage Calculator, Clark County, Nevada
How Las Vegas Compares to the National Average
Here is where the popular framing gets muddy. Depending on which tracker you read, Las Vegas is described as cheaper than average, roughly average, or slightly pricier. They are all sort of right, because they weight the categories differently. The clean way to think about it: some Las Vegas costs sit clearly below the national average, a few sit clearly above, and housing is the tie-breaker that decides which side of the line you land on.
On the below-average side, Nevada charges no state income tax, electricity per kilowatt-hour runs about a third under the national average, and healthcare tracks a little cheaper than the U.S. norm. On the above-average side, the 8.375% Clark County sales tax is higher than many states, and home prices have climbed past the national median. Groceries are close to average, maybe a hair above. Put together, cost-of-living index services generally land Las Vegas at or a little below the national baseline overall, but the honest takeaway is that the averages cancel out and your own housing decision moves the needle more than the city does.
Directional comparison. Bar length reflects position relative to the U.S. average, not a precise index. Sources: Nevada Department of Taxation, NV Energy, U.S. Census Bureau, Tax Foundation.
Don’t trust a single “cost of living index” number. Two trackers can call Las Vegas both “5% cheaper” and “3% pricier” than average at the same time, because they weight rent, home prices, and taxes differently. Build your own number from the categories that apply to you, especially housing, rather than a one-size index that assumes an average household.
Source: Tax Foundation property tax data | EnergySage Las Vegas electricity rates
Housing: Rent and Buy Prices in 2026
Housing is the largest line in almost every Las Vegas budget, so it deserves the most detail. The MIT model allocates about $1,340 a month to housing for a single adult and about $1,744 a month for a family, but those are modeled averages. What you actually pay depends heavily on whether you rent or buy and where in the valley you settle.
Renting in Las Vegas
Renting got a little easier on the wallet in 2026. A wave of new apartment supply came online across the valley, and landlords began offering concessions to fill units, which nudged average rents down slightly. The average Las Vegas apartment rented for about $1,460 a month in mid-2026 according to RentCafe, closely matching the U.S. Census Bureau’s median gross rent for the city of about $1,456. Broader trackers that include single-family home rentals, like Zillow, show an all-home average nearer $1,940, because a three-bedroom house rents for far more than a studio.
| Rental type | Typical monthly rent (2026) | Notes |
|---|---|---|
| Studio / 1-bedroom apartment | $1,300 to $1,510 | Lower in the central valley, higher in Summerlin and Henderson |
| Average apartment (all sizes) | ~$1,460 | RentCafe metro average, mid-2026 |
| 2-bedroom apartment | $1,650 to $1,900 | Varies by age and amenities of the community |
| Single-family home rental | $1,900 and up | Pulls the all-home average toward $1,940 |
Compared with the coastal California cities many transplants leave behind, those rents feel like relief, and 2026’s softer market means more availability and more room to negotiate a concession than renters had a couple of years ago.
Buying a Home in Las Vegas
Buying is a different story, because Las Vegas home prices ran to record highs. The median existing single-family home in the Las Vegas valley sold for around $475,000 in 2026, per Las Vegas REALTORS, after peaking near $489,000 in late 2025. Condos and townhomes run lower, which is why the U.S. Census Bureau’s median value across all owner-occupied homes, drawn from a broader mix and reported with a lag, sits closer to $428,000.
At that price, a 20% down payment is about $95,000, and the monthly principal-and-interest payment depends entirely on the mortgage rate you lock. The offset that keeps Las Vegas ownership manageable is property tax: Nevada’s effective rate is one of the lowest in the country, which we cover in the tax section below. The homeownership rate in the city of Las Vegas was 56.6% in the 2024 Census data and has been ticking up. For the full housing-market and demographic picture, our Las Vegas population and real estate statistics guide (linked in Related Resources below) breaks down prices, inventory, and who is buying.
Explore Our Las Vegas Car Service
Source: RentCafe Las Vegas rent trends | Zillow Las Vegas rental market
Cost of Living by Neighborhood: Where in the Valley You Land
The metro-wide averages above are a starting point, but the Las Vegas valley is big, and what you pay swings a lot depending on which part of it you choose. Two homes of the same size can carry very different price tags, rents, and even property-tax bills across town, so it pays to match your neighborhood to your budget and your commute rather than assuming one citywide number.
At the higher end sit the master-planned communities: Summerlin on the west rim of the valley and Henderson’s Green Valley and Lake Las Vegas areas to the southeast. These draw a premium for newer construction, amenities, and well-regarded schools, so both home prices and rents run above the metro average there. The central valley, the east side, and older neighborhoods closer to the Strip corridor generally offer the most affordable rents and the oldest housing stock. North Las Vegas has become a value play for buyers, with newer subdivisions at lower price points, though the trade-off is a longer drive to the Strip and the airport.
Property tax is a subtle example of how location changes the math. Because overlapping school, water, and improvement districts are drawn differently across the valley, effective property-tax rates vary by ZIP code: homeowners in Summerlin’s 89138 have carried a median effective rate around 1.11%, while parts of the east valley like 89122 sit closer to 0.57%. Same county, same low-tax reputation, meaningfully different bills. The practical takeaway for a mover: shortlist two or three areas, then price your specific housing and commute rather than trusting a single valley-wide figure. A shorter commute also trims the transportation line, which we cover next.
Source: Clark County property-tax rate data by area
Utilities: Why Summer Is the Budget Wildcard
Utilities in Las Vegas come with a seasonal twist that catches new residents off guard: the electric bill. In a desert where summer highs routinely top 105 degrees, air conditioning runs almost nonstop from June through September, and that shows up on the NV Energy bill.
On an annual average, NV Energy’s typical Southern Nevada residential electric bill is about $154 a month. Spread across the year that sounds moderate, and Las Vegas electricity is genuinely cheap per unit, roughly 33% below the national average per kilowatt-hour. But the average masks the swing: winter bills can be modest while July and August bills climb sharply as the air conditioner fights the heat. Budget for the peak, not the average, and you will not be surprised.
There is some relief on the horizon: NV Energy filed with the Public Utilities Commission of Nevada in August 2026 to cut Southern Nevada electric rates starting that October, which would trim a typical single-family bill by about $5 a month. Beyond electricity, plan for water and sewer through the Las Vegas Valley Water District, natural gas through Southwest Gas if your home has it, and internet and mobile service, which the MIT model pegs at about $151 a month combined. Add it up and a realistic all-in utility budget for a single-family home runs meaningfully above the electric line alone, especially in summer.
Personal Sedan Services tip: the single biggest utility saver in Las Vegas is a well-sealed home and a smart thermostat set a few degrees higher while you are out. Because electricity is cheap per unit but you use so much of it cooling in summer, small efficiency gains compound over the hottest four months.
Source: NV Energy Southern Nevada rate filing (Aug 2026)
Groceries and Eating Out
Food is a category where Las Vegas lands close to the national middle. The MIT Living Wage Calculator budgets about $353 a month in groceries for a single adult and about $1,034 a month for a family of four in Clark County, and market trackers put local grocery prices only marginally above the U.S. average. In practice, the valley is well served by every major grocery chain plus warehouse clubs and international markets, so a careful shopper can hold to that grocery number.
Where the food budget really moves is dining out, and Las Vegas gives you the full range. A quick local meal off the Strip is ordinary-city priced, while a night out on the Strip, with its resort markups, is a different universe. The MIT baseline assumes a mostly-cook-at-home household, so if you eat out often, add a discretionary line on top of the grocery figure rather than assuming it is included.
Groceries only, cook-at-home baseline. Source: MIT Living Wage Calculator, Clark County NV (Feb 2026), annual figures converted to monthly.
Source: MIT Living Wage Calculator, Clark County, Nevada


Transportation and Getting Around
Las Vegas is a car town. The valley sprawls, the summer heat makes walking a chore for much of the year, and public transit, while present, does not reach everywhere quickly. That makes transportation one of the larger and most overlooked budget lines. The MIT model estimates about $759 a month for a single adult once you fold in a car payment, insurance, fuel, and maintenance, rising to about $1,273 a month for a family running two vehicles.
Two Las Vegas-specific factors push that number up. First, Nevada auto insurance premiums run above the national average, so budget more for coverage than you might elsewhere. Second, everyday distances are long, so fuel and wear add up. The upside is no state emissions-driven surcharges on income and generally straightforward registration.
Here is a money-saving angle a lot of transplants miss. A second car is one of the easiest big expenses to avoid. Between the payment, a second insurance policy, and maintenance, a rarely-used second vehicle can cost hundreds a month. Households that skip it lean on a mix of ride options, and the smart move is not surge-priced rideshare, which spikes exactly when you need it (weekend nights, event days, airport rushes), but a flat-rate, pre-booked car service that quotes the price up front. For airport runs especially, a reserved pickup beats standing in a taxi line or watching an app fare climb. If you are moving to town, our Las Vegas airport transportation gets you and your boxes from Harry Reid International to your new place at a set rate.
Reserve Everyday Local Transportation
Source: MIT Living Wage Calculator, Clark County, Nevada
Healthcare Costs
Healthcare is a quiet win in the Las Vegas budget. Costs track a little below the national average, and the MIT model budgets about $226 a month for a single adult and about $651 a month for a family of four in Clark County. Those figures assume employer-based or comparably priced coverage; a person buying an individual marketplace plan without subsidies will pay more, so price your specific plan rather than assuming the average.
The nuance that does not show up in a dollar figure is access. Las Vegas has historically run below the national average on physicians per capita, so wait times for certain specialists can be longer than in some larger metros. Budget-wise healthcare is a plus; plan ahead for specialist appointments and you avoid the main downside. For seniors and residents managing regular medical appointments who would rather not drive themselves or rely on rideshare, a scheduled senior and medical appointment car service keeps that part of life predictable.
Source: MIT Living Wage Calculator, Clark County, Nevada
Childcare and Family Costs
If you are moving to Las Vegas with young children, this is the section that reshapes your whole budget. Childcare is the single largest variable cost for families, and it can rival or exceed the housing payment. The MIT Living Wage Calculator budgets about $14,368 a year for one child in Clark County, roughly $1,197 a month, and about $28,067 a year for two children, roughly $2,339 a month.
That is why a single parent with one child needs about $86,700 a year before taxes in the MIT model, and a two-earner family of four needs about $121,900. The childcare line explains almost the entire gap between a single adult’s budget and a family’s. Once children reach public-school age the cost drops sharply, but for the early years it is the number that determines whether one parent working actually nets more than they spend on care. Families relocating for the no-income-tax advantage should run this number first, because childcare can quietly cancel out the tax savings during the daycare years.
After-tax monthly living costs. Nearly $2,340 of the family total is childcare. Source: MIT Living Wage Calculator, Clark County NV (Feb 2026).
Source: MIT Living Wage Calculator, Clark County, Nevada
Taxes: Nevada’s Big Advantage and Its Limits
Taxes are the reason a lot of people move to Las Vegas in the first place, and the reason the cost of living can feel lower than the raw prices suggest. Nevada is one of the few states with no personal state income tax and no local income tax. For a household earning a solid income, keeping the 5% to 9% that a state like California would take is a real, recurring raise.
The state makes up the revenue in other ways, and it is worth seeing the whole picture before you assume Nevada is a flat-out cheap state. The main offset is sales tax: the combined rate in Las Vegas and the rest of Clark County is 8.375%, made up of the 4.6% state rate plus 3.775% in county and local add-ons, in place since January 1, 2020. Groceries and prescription drugs are exempt, which softens the blow on essentials, but the rate is higher than many states charge.
| Tax | Las Vegas / Clark County | How it compares |
|---|---|---|
| State income tax | 0% | None; a major relocation draw |
| Local income tax | 0% | None |
| Combined sales tax | 8.375% | Above average; groceries and Rx exempt |
| Effective property tax rate | ~0.44% to 0.55% | Among the lowest in the U.S. |
| Property tax cap | 3% per year (primary home) | Limits how fast your bill can rise |
Property tax is the other pleasant surprise. Nevada’s effective property tax rate on owner-occupied homes is roughly 0.44% to 0.55%, well below the national norm, and the state caps how much a primary residence’s tax bill can rise each year at 3%. On a home valued around $430,000, that works out to roughly $2,000 a year in property tax, far less than an owner would pay on a comparable home in many other states. Taken together, the tax structure is genuinely favorable, especially for higher earners and homeowners; it just is not a total free ride once the 8.375% sales tax is in the mix.
Source: Nevada Department of Taxation, Clark County sales tax rate | Tax Foundation property tax data

Sample Monthly Budgets: Single, Couple, Family
Now put the categories together. The table below shows modeled monthly budgets for three household types, built from the MIT Living Wage Calculator’s Clark County figures and converted from annual to monthly. These are baseline “cover the needs” budgets, not comfortable-with-extras budgets, so treat them as the floor you build savings and discretionary spending on top of.
Personal Sedan Services Analysis: the monthly figures below are derived by taking the MIT Living Wage Calculator’s published annual expense figures for Clark County, NV (updated February 2026) and dividing by 12. Calculation and presentation original to Personal Sedan Services; underlying data from MIT.
| Category (monthly) | Single adult | Single parent, 1 child | Family of 4 (2 kids) |
|---|---|---|---|
| Housing | $1,340 | $1,744 | $1,744 |
| Childcare | $0 | $1,197 | $2,339 |
| Food (groceries) | $353 | $519 | $1,034 |
| Transportation | $759 | $878 | $1,273 |
| Healthcare | $226 | $546 | $651 |
| Civic / other essentials | $323 | $545 | $819 |
| Internet & mobile | $151 | $151 | $202 |
| Other necessities | $416 | $756 | $900 |
| Total monthly (after tax) | $3,568 | $6,336 | $8,963 |
| Pre-tax income needed | $4,195 | $7,229 | $10,159 |
Two things jump out. The single adult and the single parent live in the same housing bracket, but the parent’s budget is nearly double, entirely because of childcare and higher food and healthcare. And every household still owes taxes even in no-income-tax Nevada, through payroll, sales, and property taxes, which is why the pre-tax income needed sits above the after-tax living cost in every column.

How Much Income You Need
Flip the budget around and ask the question most people actually care about: what do I need to earn? The MIT Living Wage Calculator sets the bare living wage for a single adult in Clark County at $24.20 an hour, about $50,300 a year before taxes. That is the “keep the lights on” floor, not a comfortable target.
For comfort, meaning you cover the basics and still save, travel, and absorb a surprise expense, most single adults aim higher, in the $60,000 to $75,000 range. That is not a guess pulled from thin air: Las Vegas’s own median household income was about $73,900 in the 2024 American Community Survey, so a solidly middle-of-the-pack Las Vegas household earns right around there. A family of four supporting two kids in daycare needs the household to bring in roughly $121,900 before taxes to hit the MIT baseline, which usually means two earners.
The tax advantage quietly boosts every one of these figures. Because Nevada takes no state income tax, a Las Vegas salary stretches further than the same salary in a high-tax state, which is exactly why the city keeps pulling in remote workers, retirees, and Californians looking for more house per dollar. If you want the deeper demographic and jobs picture, or you are weighing whether the city is on the way up or down, the related Las Vegas guides at the end of this article put the growth story in context.
Source: MIT Living Wage Calculator, Clark County, Nevada | U.S. Census Bureau ACS data for Las Vegas, NV
Las Vegas vs the Cities People Move From
Most people asking about the cost of living in Las Vegas are comparing it to somewhere else, and for a large share of transplants that somewhere is a pricier Western metro. The contrast shows up hardest on two lines: home prices and state income tax. On both, Las Vegas wins the comparison against coastal California by a wide margin, and edges out its closest peer, Phoenix, on taxes.
| City | Median home price (2026) | State income tax |
|---|---|---|
| Las Vegas, NV | ~$475,000 | 0% |
| Phoenix, AZ | ~$458,000 | 2.5% flat |
| Los Angeles, CA | ~$888,000 | Up to 13.3% |
| San Diego, CA | ~$985,000 | Up to 13.3% |
The California gap is the dramatic one. A homeowner selling a Los Angeles or San Diego house near a million dollars can buy comfortably in Las Vegas for roughly half, then keep the 9% to 13% that California would have taken out of every future paycheck. That combination, mid-priced homes plus no state income tax, is the core of the Las Vegas relocation math and a big reason the valley keeps drawing Californians.
Phoenix is the closer contest. Home prices are in the same neighborhood as Las Vegas, and Arizona’s flat 2.5% income tax is low by national standards, but Nevada’s flat zero still beats it. The tie-breakers between the two Southwest metros usually come down to the specific things in this guide: your housing choice, your utility exposure in the summer heat (both are hot), and your household size. On the pure tax line, Las Vegas keeps its edge.
Source: Zillow San Diego home values | Tax Foundation state tax data
Cost of Living at a Glance
One reference table for the whole picture. Figures are 2026 metro-wide estimates from the primary sources cited throughout this guide.
| Cost item | Typical figure (2026) | Source |
|---|---|---|
| Single adult, monthly cost of living | ~$3,570 | MIT Living Wage Calculator |
| Single adult, pre-tax income needed | ~$50,300 / yr | MIT Living Wage Calculator |
| Single adult living wage | $24.20 / hr | MIT Living Wage Calculator |
| Family of four, monthly (after tax) | ~$8,960 | MIT Living Wage Calculator |
| Family of four, pre-tax income needed | ~$121,900 / yr | MIT Living Wage Calculator |
| Average apartment rent | ~$1,460 / mo | RentCafe |
| Census median gross rent | ~$1,456 / mo | U.S. Census Bureau |
| All-home average rent | ~$1,940 / mo | Zillow |
| Median single-family home sale price | ~$475,000 | Las Vegas REALTORS |
| Census median owner-occupied home value | ~$428,000 | U.S. Census Bureau |
| Homeownership rate (city) | 56.6% | U.S. Census Bureau (2024) |
| Average electric bill | ~$154 / mo | NV Energy |
| Electricity vs U.S. average | ~33% below | EnergySage |
| Internet & mobile | ~$151 / mo | MIT Living Wage Calculator |
| Groceries, single adult | ~$353 / mo | MIT Living Wage Calculator |
| Groceries, family of four | ~$1,034 / mo | MIT Living Wage Calculator |
| Transportation, single adult | ~$759 / mo | MIT Living Wage Calculator |
| Healthcare, single adult | ~$226 / mo | MIT Living Wage Calculator |
| Childcare, one child | ~$1,197 / mo | MIT Living Wage Calculator |
| Childcare, two children | ~$2,339 / mo | MIT Living Wage Calculator |
| State income tax | 0% | State of Nevada |
| Combined sales tax | 8.375% | Nevada Dept. of Taxation |
| Effective property tax rate | ~0.44% to 0.55% | Tax Foundation |
| Median household income (city) | ~$73,900 | U.S. Census Bureau (2024) |
How to Keep Your Las Vegas Budget in Check
The numbers above are the baseline. Where residents actually save money is in a handful of Las Vegas-specific decisions, most of which the newcomer learns the hard way in their first year. Here is what the data points toward if you would rather learn it up front.
Budget for the summer electric spike, not the yearly average. A $154 average bill sounds tame, but June through September will run well above it as the air conditioning fights triple-digit heat. Set money aside in the mild months, seal the home, and nudge the thermostat up while you are out; because you use so many cheap kilowatt-hours cooling in summer, small efficiency gains compound over four brutal months.
Use the soft 2026 rental market. New apartment supply and landlord concessions gave renters negotiating room they did not have a couple of years ago. Ask for a free month, a waived fee, or a lower renewal, and compare a couple of communities against each other. The average rent dipped slightly in 2026 precisely because landlords are competing, so it is a renter’s moment to negotiate.
Question the second car. Transportation is one of the largest lines in the budget, and a rarely-used second vehicle stacks a payment, a second insurance policy, and maintenance on top of each other. Households that drop it and mix in a flat-rate, pre-booked ride for airport runs, event nights, and appointments often come out ahead of both a second car and surge-priced rideshare, which spikes exactly when demand does.
Owners: lean on the tax structure. Nevada’s low effective property-tax rate and the 3% annual cap on a primary residence’s tax bill are real, durable advantages. Make sure your home is filed as your primary residence so the cap applies, and remember the zero state income tax quietly lifts every take-home paycheck.
Separate grocery money from Strip money. Local groceries run close to the national average, but a night out on the Strip carries resort-level markups. Keep the two in different mental buckets so a fun weekend does not quietly blow up a reasonable monthly food budget.
Moving to Las Vegas: What to Do Next
If this budget makes Las Vegas look workable for you, here is a practical order of operations for the move, with what to prioritize and roughly when.
| Action | Priority | Timeline | Where it fits |
|---|---|---|---|
| Price your specific housing (rent a target area first, or get pre-approved) | High | 1 to 3 months out | Biggest budget line |
| Run your real numbers for household size, especially childcare | High | 1 to 2 months out | Determines income needed |
| Confirm the no-income-tax gain against the 8.375% sales tax and your spending | Medium | 1 to 2 months out | Net tax picture |
| Budget for peak summer electric bills, not the annual average | Medium | Before your first summer | Utilities |
| Decide whether you truly need a second car or a flat-rate ride option | Medium | First 1 to 2 months | Transportation |
| Arrange a set-rate airport pickup for arrival day | Low | Move week | Getting settled |
On arrival, the small stuff is where surge pricing and taxi lines quietly drain a moving budget. A pre-booked, licensed driver from Harry Reid International to your new address is one predictable cost on a chaotic day, and it is the kind of everyday reliability residents keep using long after the boxes are unpacked. We serve the entire Las Vegas metro area, from the central valley to Summerlin and Henderson.
Related Resources
Go deeper on the numbers behind your move:
- Las Vegas population and real estate statistics: home prices, inventory, and who is moving in.
- Is Las Vegas dying? What the 2026 data actually shows: the growth-versus-decline debate, settled with data.
- Las Vegas tourism statistics: the visitor economy that shapes local jobs and prices.
Primary data sources:
Frequently Asked Questions
How much does it cost to live in Las Vegas per month?
Is Las Vegas cheaper than the national average?
How much do you need to make to live comfortably in Las Vegas?
How much is rent in Las Vegas in 2026?
Does Las Vegas have a state income tax?
What is the sales tax in Las Vegas?
How much are utilities in Las Vegas?
Is it expensive to own a car in Las Vegas?
Sources and Methodology
How we built this budget
The category-by-category monthly figures in this guide are derived from the MIT Living Wage Calculator for Clark County, Nevada (data updated February 15, 2026), a widely used academic model that builds a minimum realistic budget for each household type in a specific county. We converted its published annual expense figures to monthly by dividing by 12. Housing, rent, home price, tax, utility, and income figures come from the additional primary sources listed below. We did not use aggregator estimates for any hard figure; where an index-style comparison is directional (such as “about 33% below the national average”), it is labeled as such.
- MIT Living Wage Calculator, Clark County, NV (per-category budgets, living wage, income needed, by household type).
- U.S. Census Bureau QuickFacts / American Community Survey, Las Vegas city (median household income ~$73,900, homeownership 56.6%, median home value, median gross rent; 2024 data).
- RentCafe and Zillow (2026 rent averages).
- Las Vegas REALTORS 2026 market reports (median single-family home price ~$475,000).
- Nevada Department of Taxation (Clark County combined sales tax 8.375%).
- Tax Foundation (Nevada effective property tax rate).
- NV Energy and EnergySage (electric bill and rate data).
Figures reflect 2026 data available at the time of writing. Cost of living is a moving target; rents, home prices, and utility rates update regularly, so treat these as current benchmarks rather than fixed values. Last Updated: August 2026.